AxessPoint: Understanding TCA Outcomes in European Credit Markets

By David Krein, Gioacchino Accurso, PhD | 22 September 2021
Text
Highlights
- A key driver in determining price outcomes when trading electronically is the number of responses received on an RFQ. More responses equate to improved pricing with more competition among liquidity providers.
- We estimate every additional response in European Credit, YTD, improved average TCA by ~1.2 Euro cents.
- To maximize the number of responses received, clients should invite as many disclosed dealers as possible alongside seeking anonymous liquidity via Open Trading®.
What's the main TCA driver in electronic Euro credit?
Transaction Cost Analysis (TCA) is used by participants in corporate bond markets as a post-trade tool to assess the pricing and execution quality of their trading activity. When trading on an electronic venue, we see the major explanatory variable influencing TCA outcomes as the number of responses received on an order.
Using MarketAxess trading platform data, YTD, in European Credit, we see a clear correlation between responses and pricing outcomes (a similar result to our US IG analysis). The below shows average TCA vs number of responses, with each additional response improving TCA by ~1.2 cents. TCA outcomes are clearly strongly correlated with realized responses, as we see a linear correlation co-efficient (R-squared) >95%. In 2021 YTD, Euro Credit RFQs that received ten or more responses outperformed Composite+™ bid/offer, while over ~44% of trades received at least ten responses and outperformed Composite+ side.
Average TCA Delta
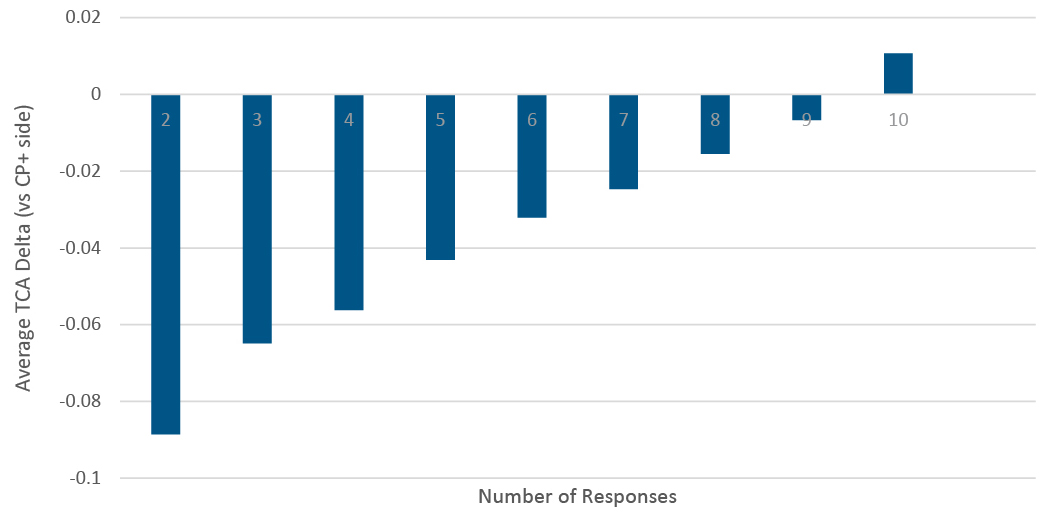
Number of responses in electronic Euro credit
To obtain maximum TCA benefits, and hence best-ex, it’s imperative that clients receive as many responses as possible. To understand response outcomes, we investigate MarketAxess trading platform data, YTD, in European Credit, and plot the number of disclosed dealers invited vs the number of responses received, when inviting Open Trading or not, see below; each dot contains data from at least 100 trades.
Average number of responses with and without Open Trading
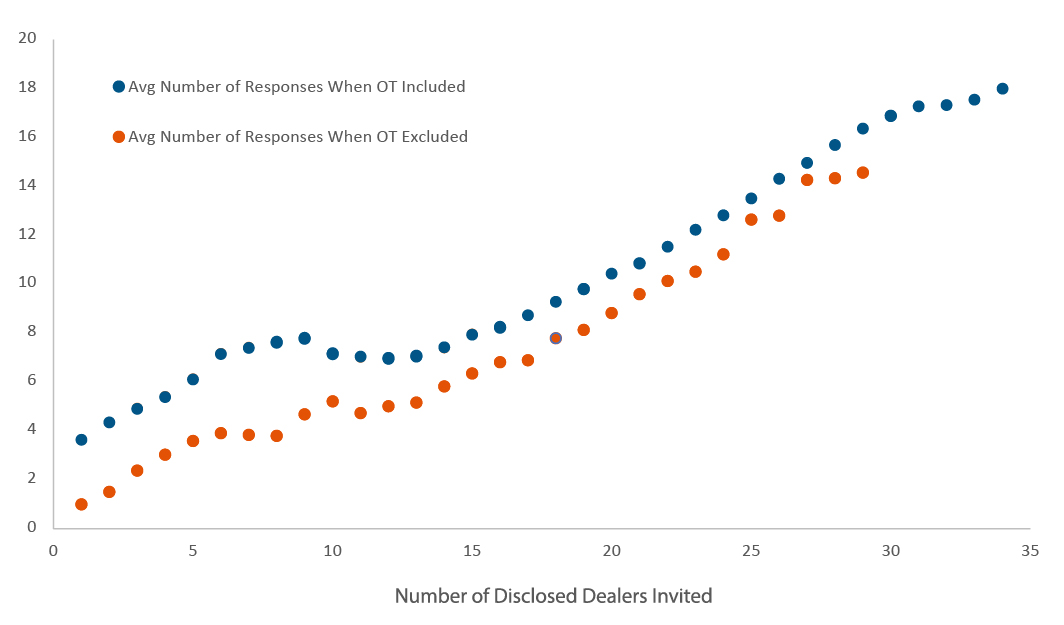
The above demonstrates how inviting more disclosed dealers does increase the response pool, with an uptick in responses when using Open Trading. The orange line has a constant gradient (a measure of the response rate) and, so, disclosed counterparties will respond regardless of whether they are put in competition or not. Moreover, the blue line also exhibits a circa constant gradient, emphasizing how counterparties will respond regardless of whether Open Trading is invited or not.
Understanding TCA outcomes is critical when making trading decisions to satisfy best-execution requirements. Superior pricing is obtained when more responses are obtained, which can be acquired by inviting as many disclosed dealers as possible alongside seeking anonymous liquidity via Open Trading.
Transaction Cost Analysis (TCA)
TCA is defined relative to Composite+ and is calculated as the difference between the trade price and the Composite+ price on the corresponding side, at inquiry time. A positive value means the trade occurred inside (more competitive than) Composite+ bid or offer, while a negative value means the trade occurred outside (less competitive than) the Composite+ bid or offer.
For questions or follow-up, email our data scientists at info@marketaxessfinance.com.